Weak base–strong acid titration curve

An example figure from the Titration Curve generator.
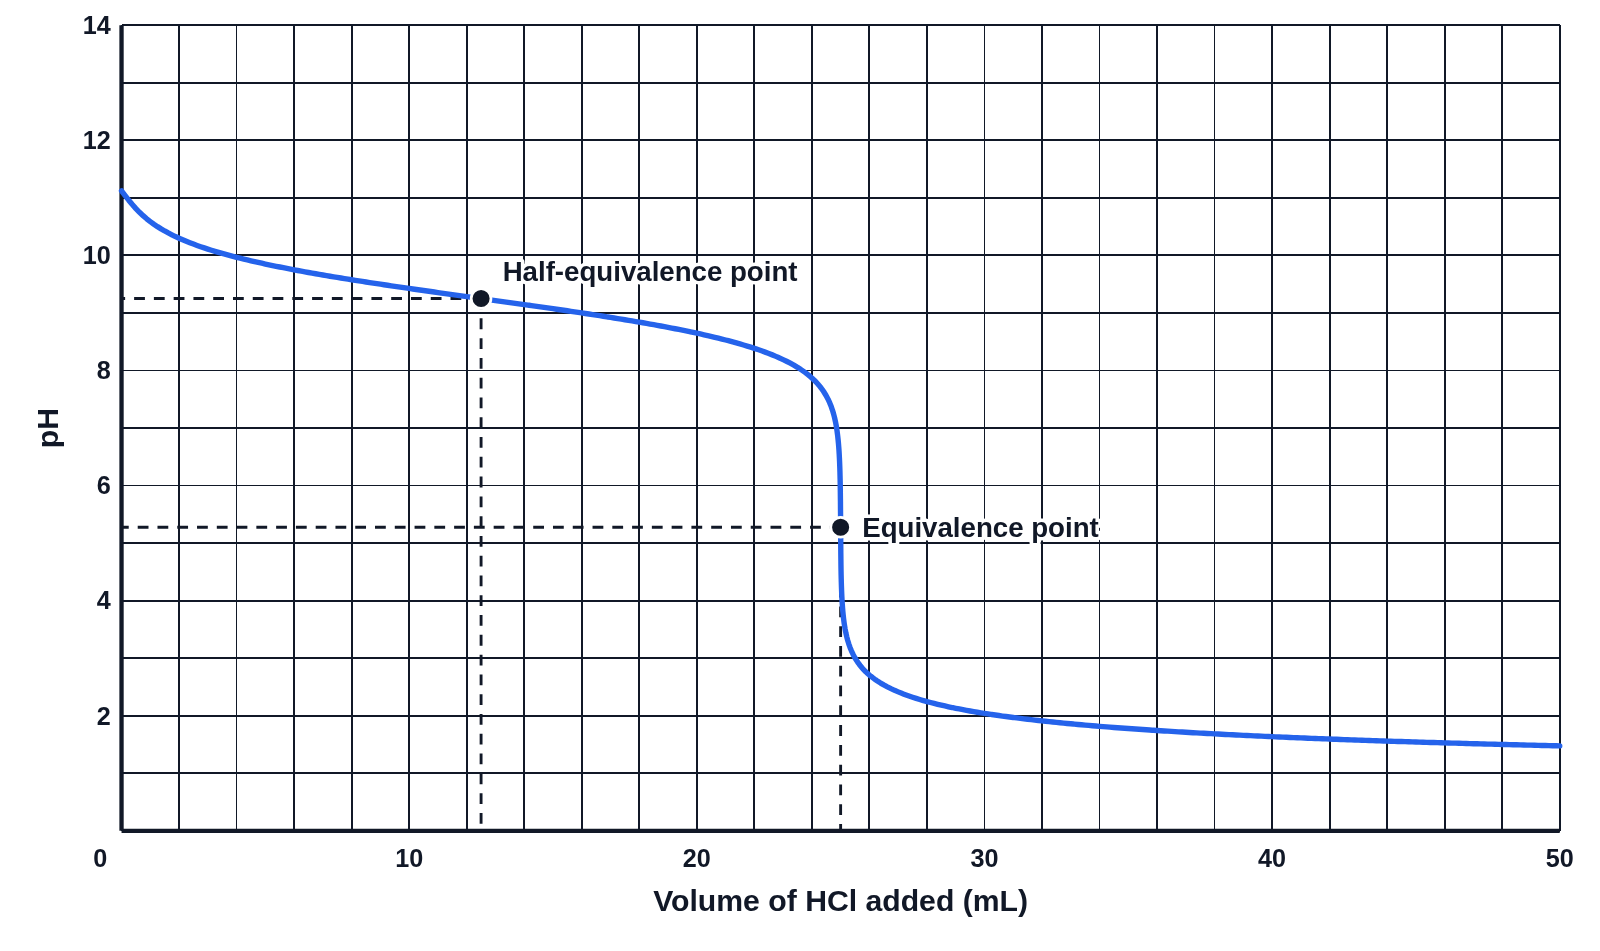
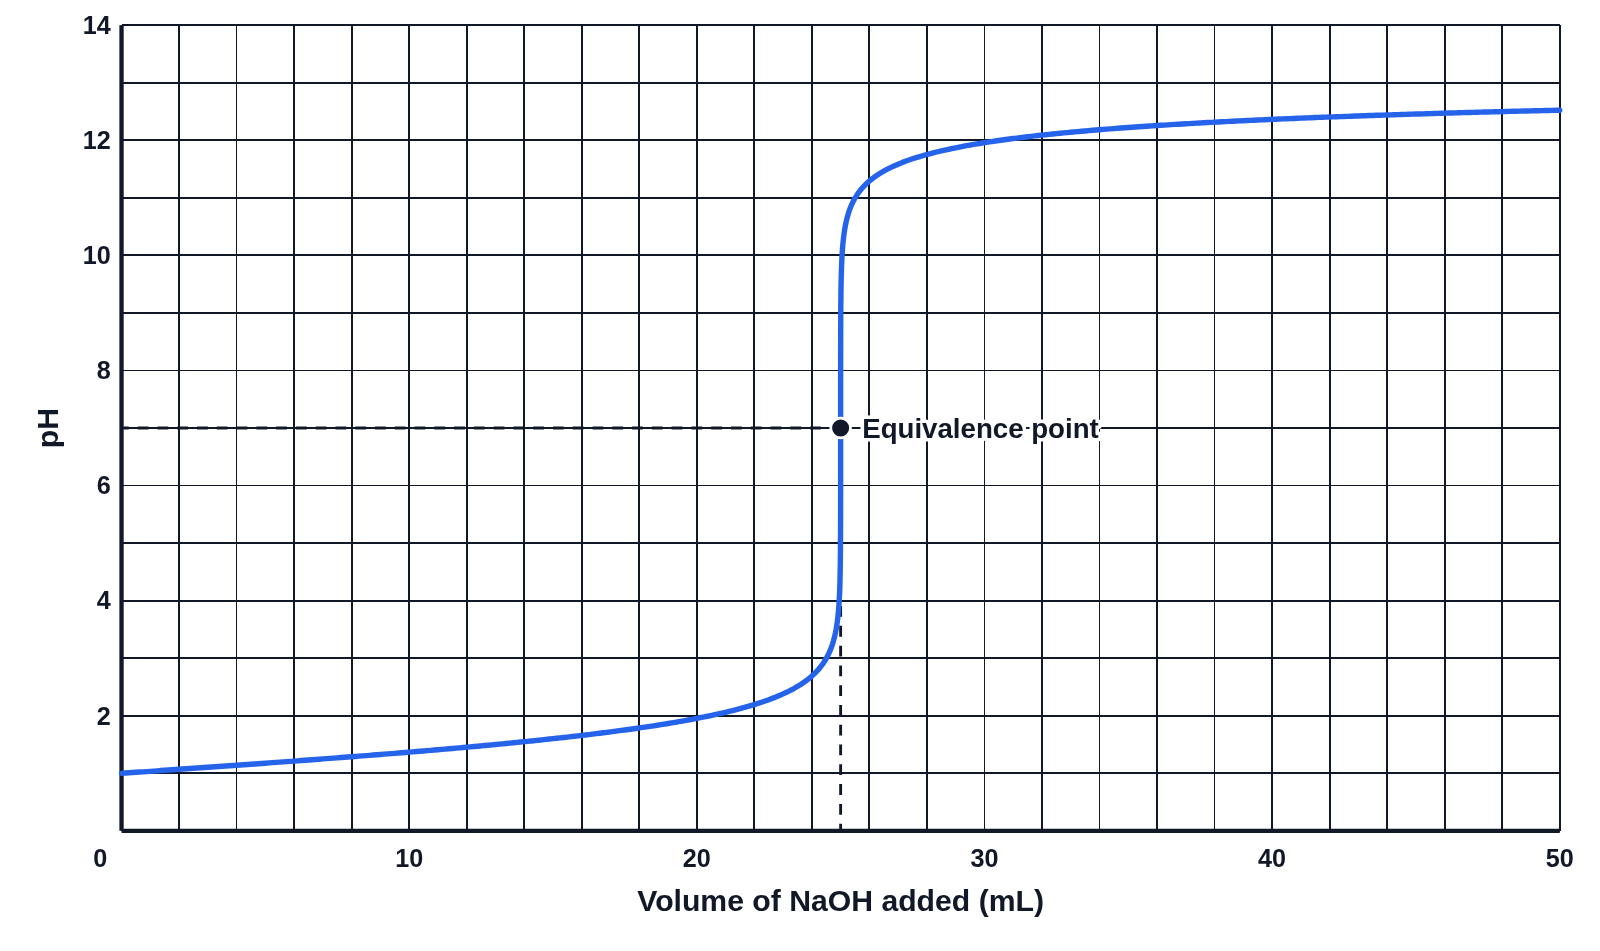
Titration curve of 25.0 mL of 0.100 M ammonia with 0.100 M HCl, the pH falling, with the equivalence and half-equivalence points marked
The pH of 25.0 mL of 0.100 M ammonia (NH₃, pKb 4.75) as 0.100 M HCl is added, up to 50 mL. The pH falls, slowly through the buffer region and then steeply at the equivalence point at 25 mL, which is below pH 7. The half-equivalence point at 12.5 mL, where the pH equals 14 − pKb, is marked too.

Editing opens it in Titration Curve with these settings, to change anything and copy or download your own.

Answer key

  • Starting pH: 11.12
  • Equivalence point: 25 mL, pH 5.28
  • Half-equivalence point: 12.5 mL, pH 9.25

Free to use in your tests, worksheets, slides or anything else. Open source under Apache 2.0. How to reuse our figures
More Titration Curve examples