Photoelectron spectrum of iron

An example figure from the Photoelectron Spectrum generator.
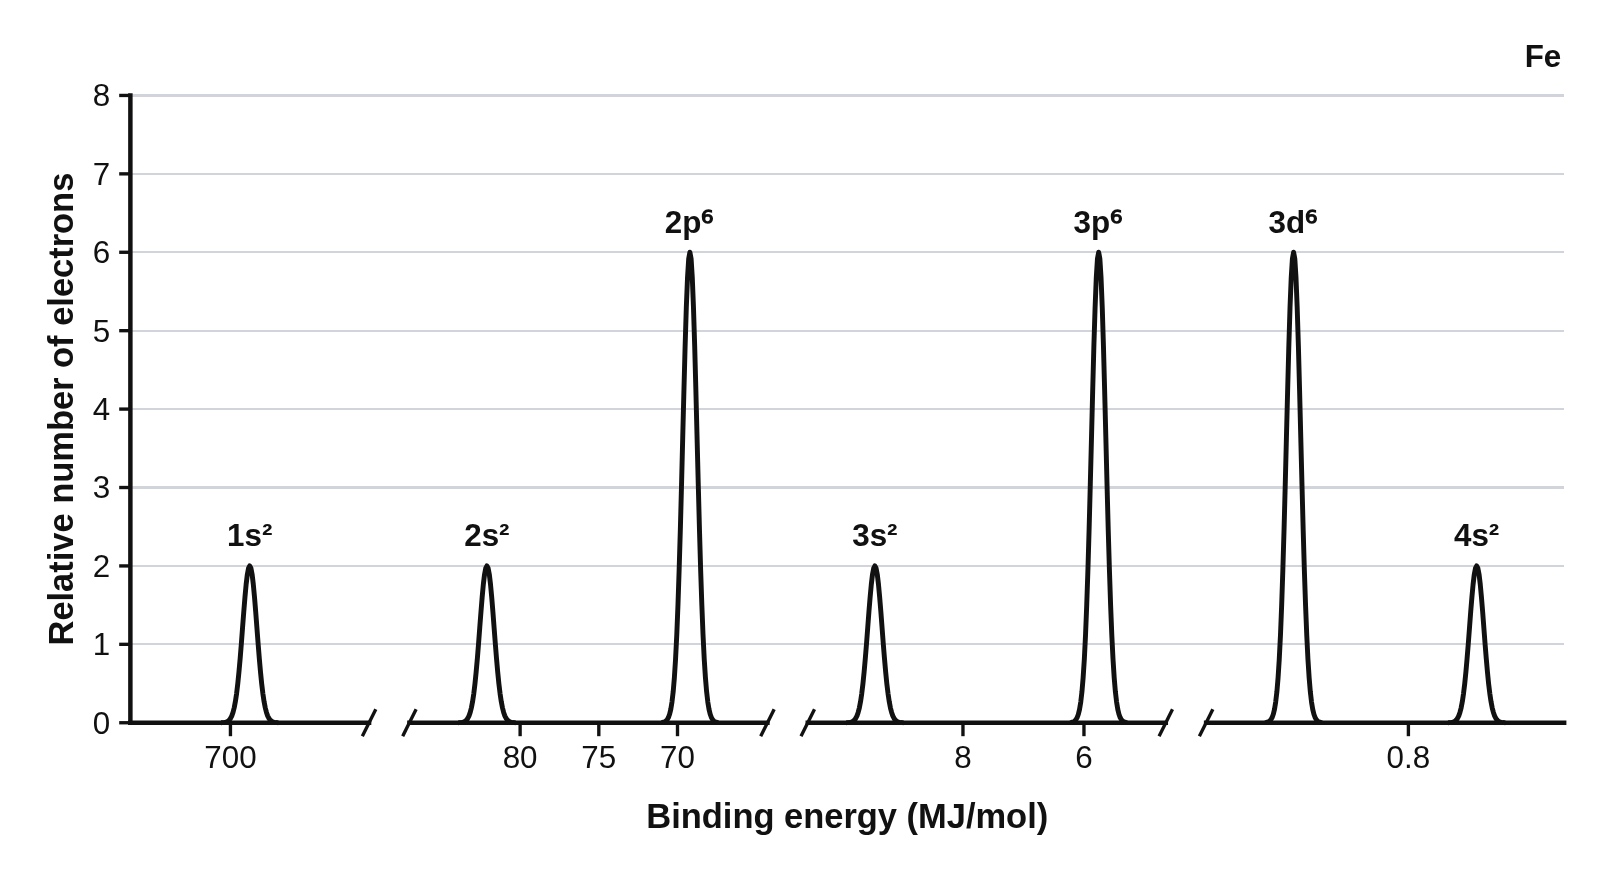
The photoelectron spectrum of iron with seven peaks from 1s² to 4s², the 3d⁶ peak just left of the 4s² peak
The photoelectron spectrum of an iron atom, 1s² 2s² 2p⁶ 3s² 3p⁶ 3d⁶ 4s², on a broken binding energy axis in MJ/mol, each group of nearby peaks given its own stretch. The 3d peak sits just to the left of the 4s peak: although 4s fills first, its electrons are held less tightly, which is why iron loses its 4s electrons first when it forms ions.

Editing opens it in Photoelectron Spectrum with these settings, to change anything and copy or download your own.

Answer key

  • Iron (Fe): 1s² 2s² 2p⁶ 3s² 3p⁶ 4s² 3d⁶
  • Peaks (MJ/mol, left to right): 1s 687, 2s 82.1, 2p 69.2, 3s 9.46, 3p 5.76, 3d 0.87, 4s 0.76

Free to use in your tests, worksheets, slides or anything else. Open source under Apache 2.0. How to reuse our figures
More Photoelectron Spectrum examples