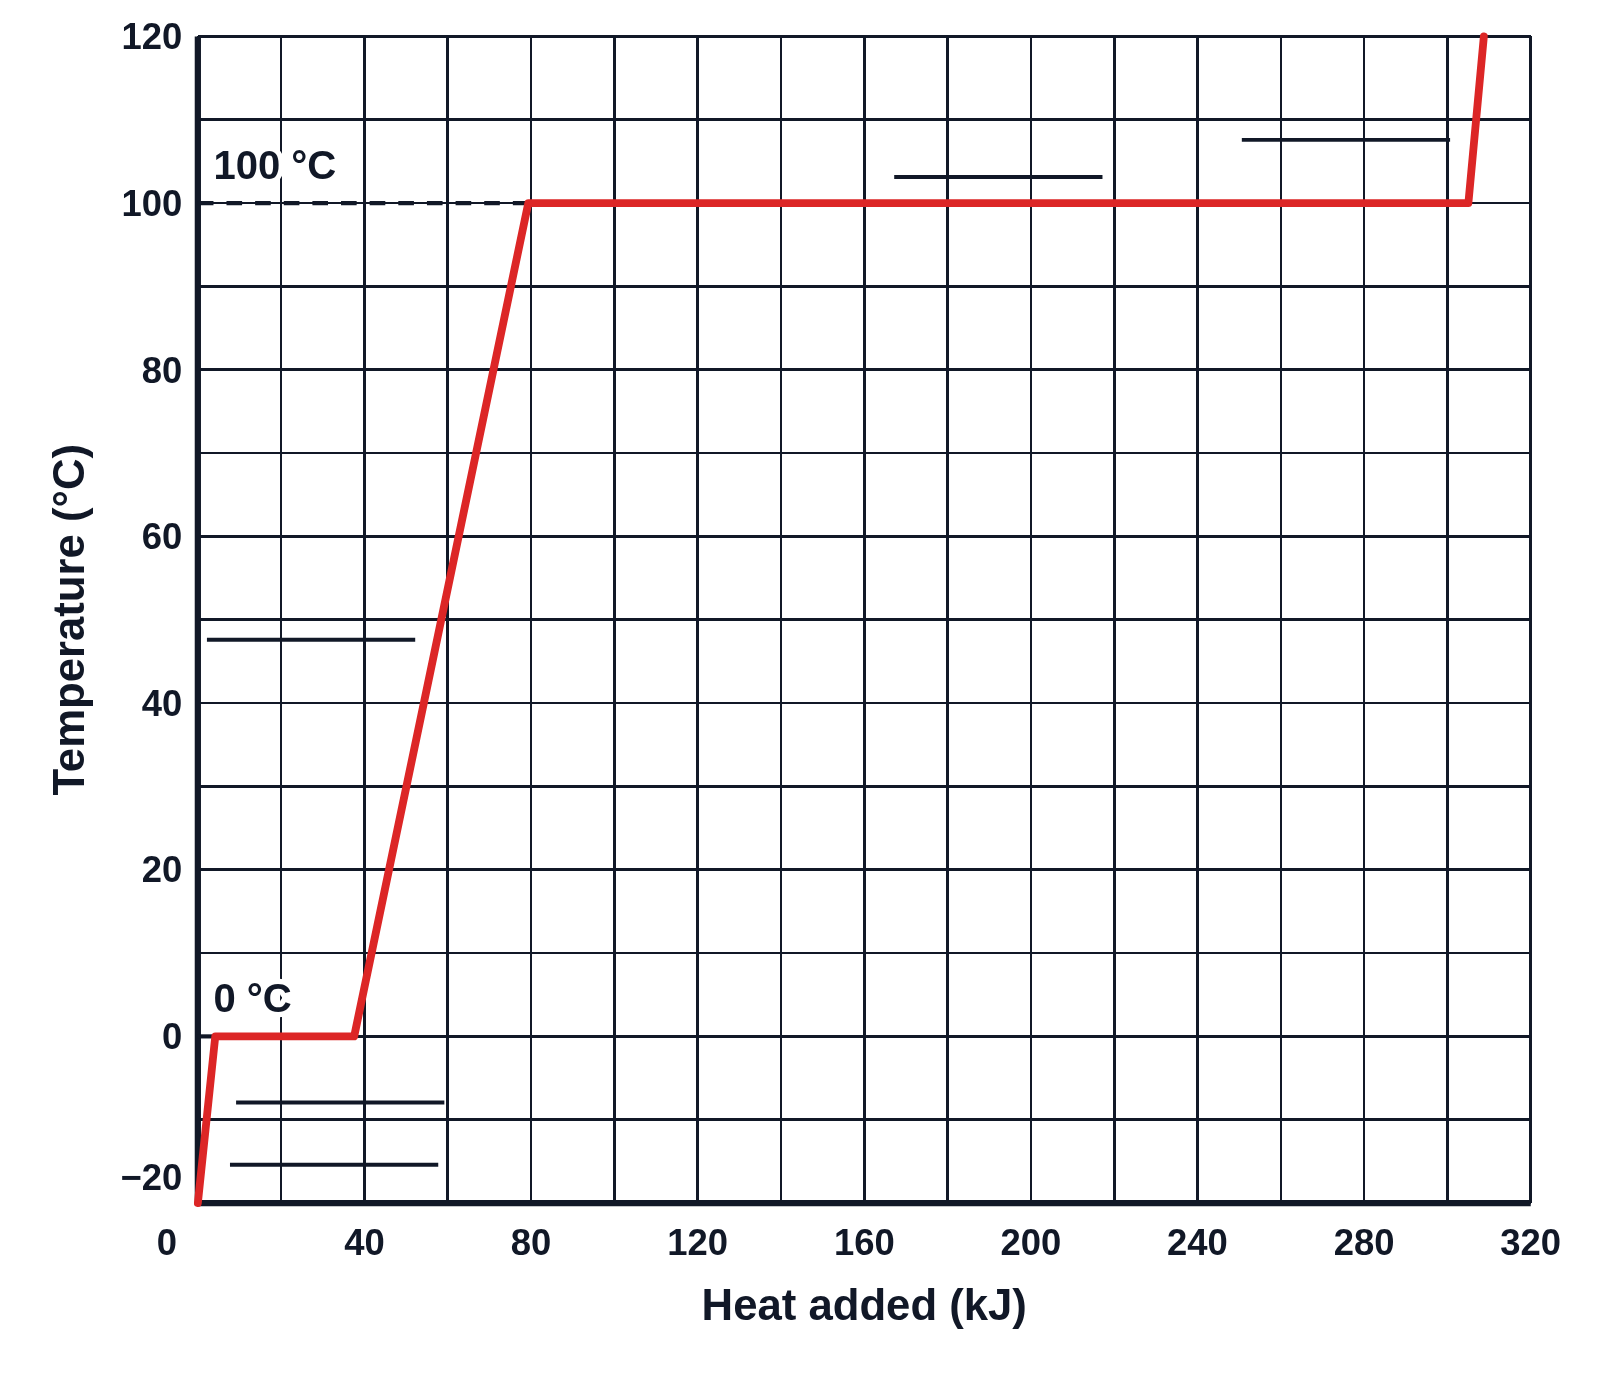
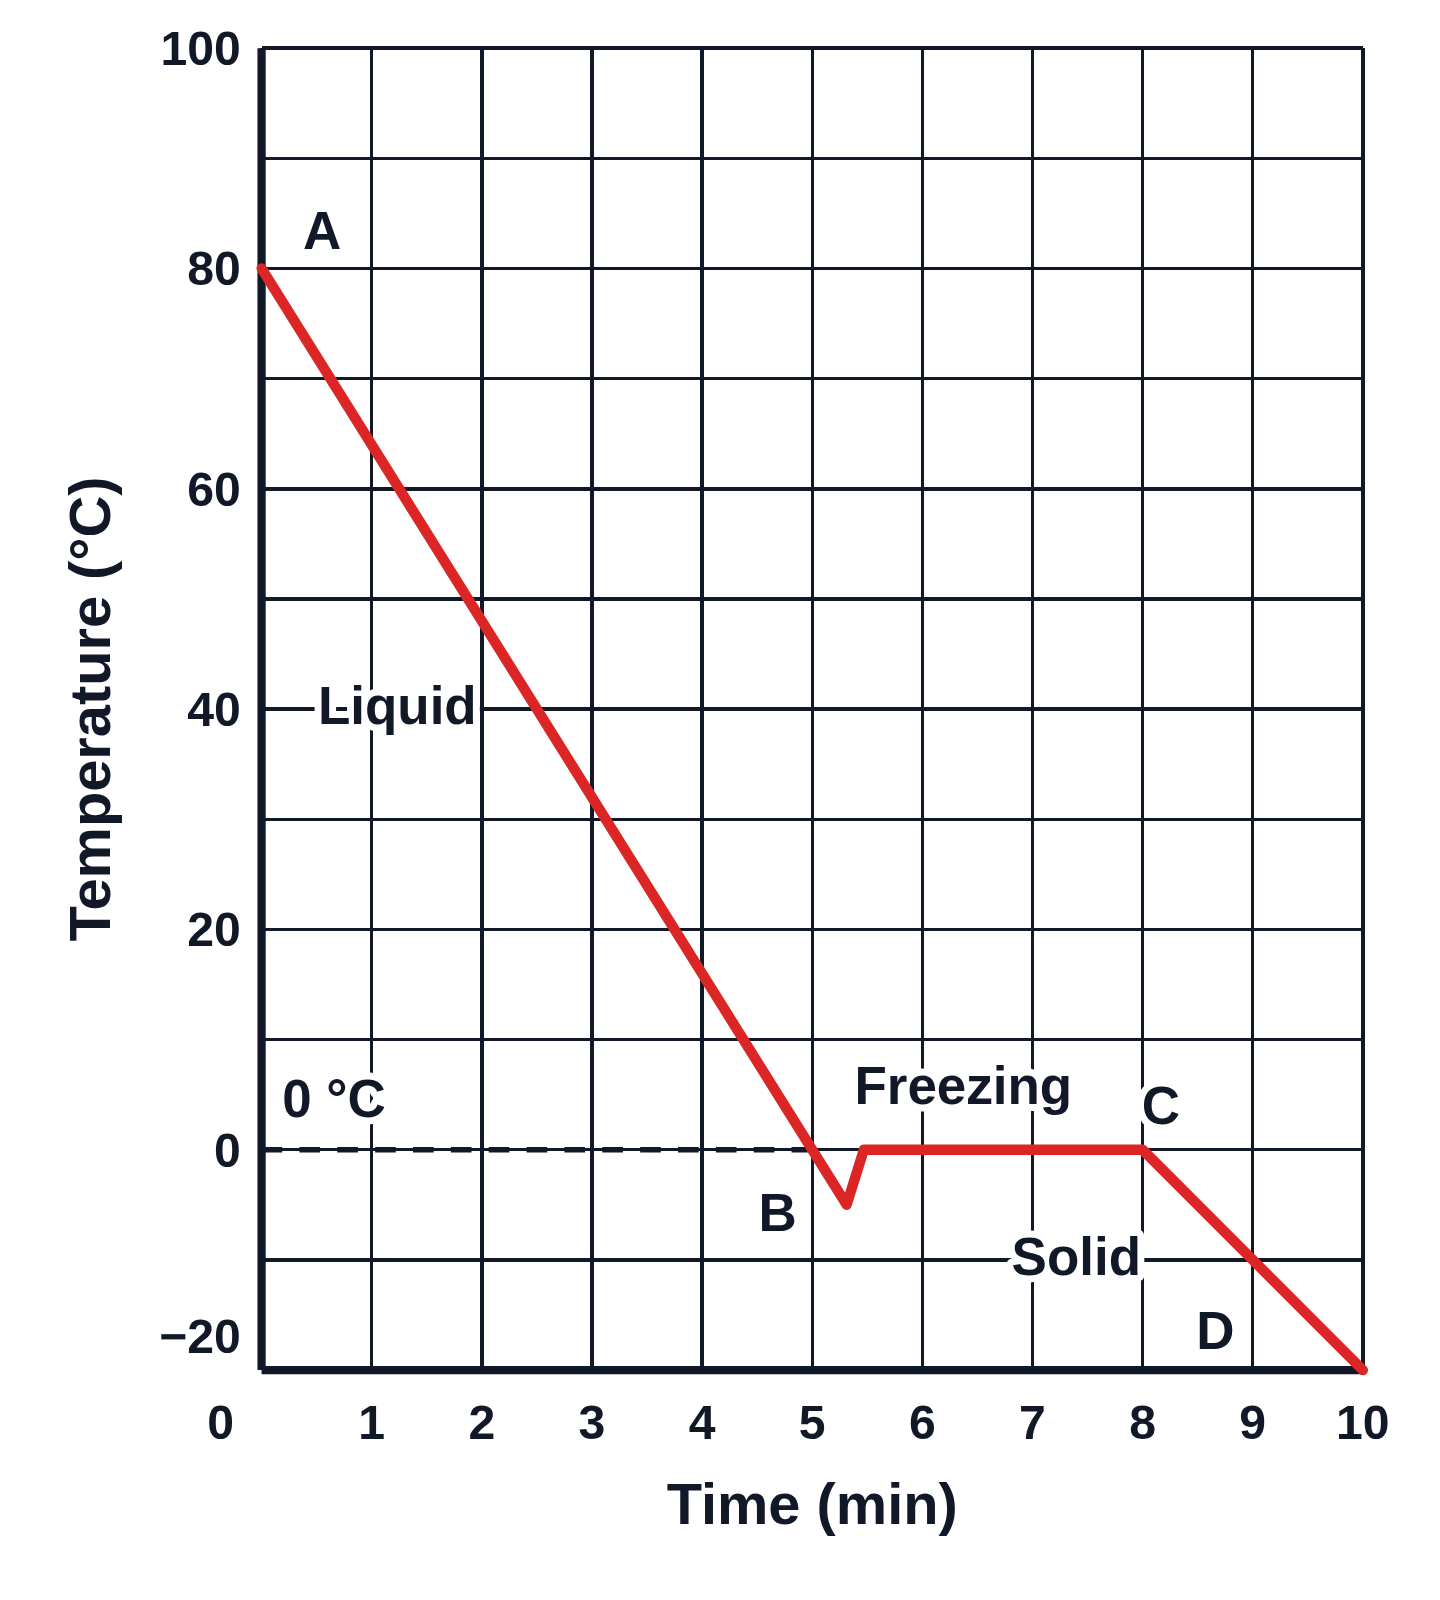
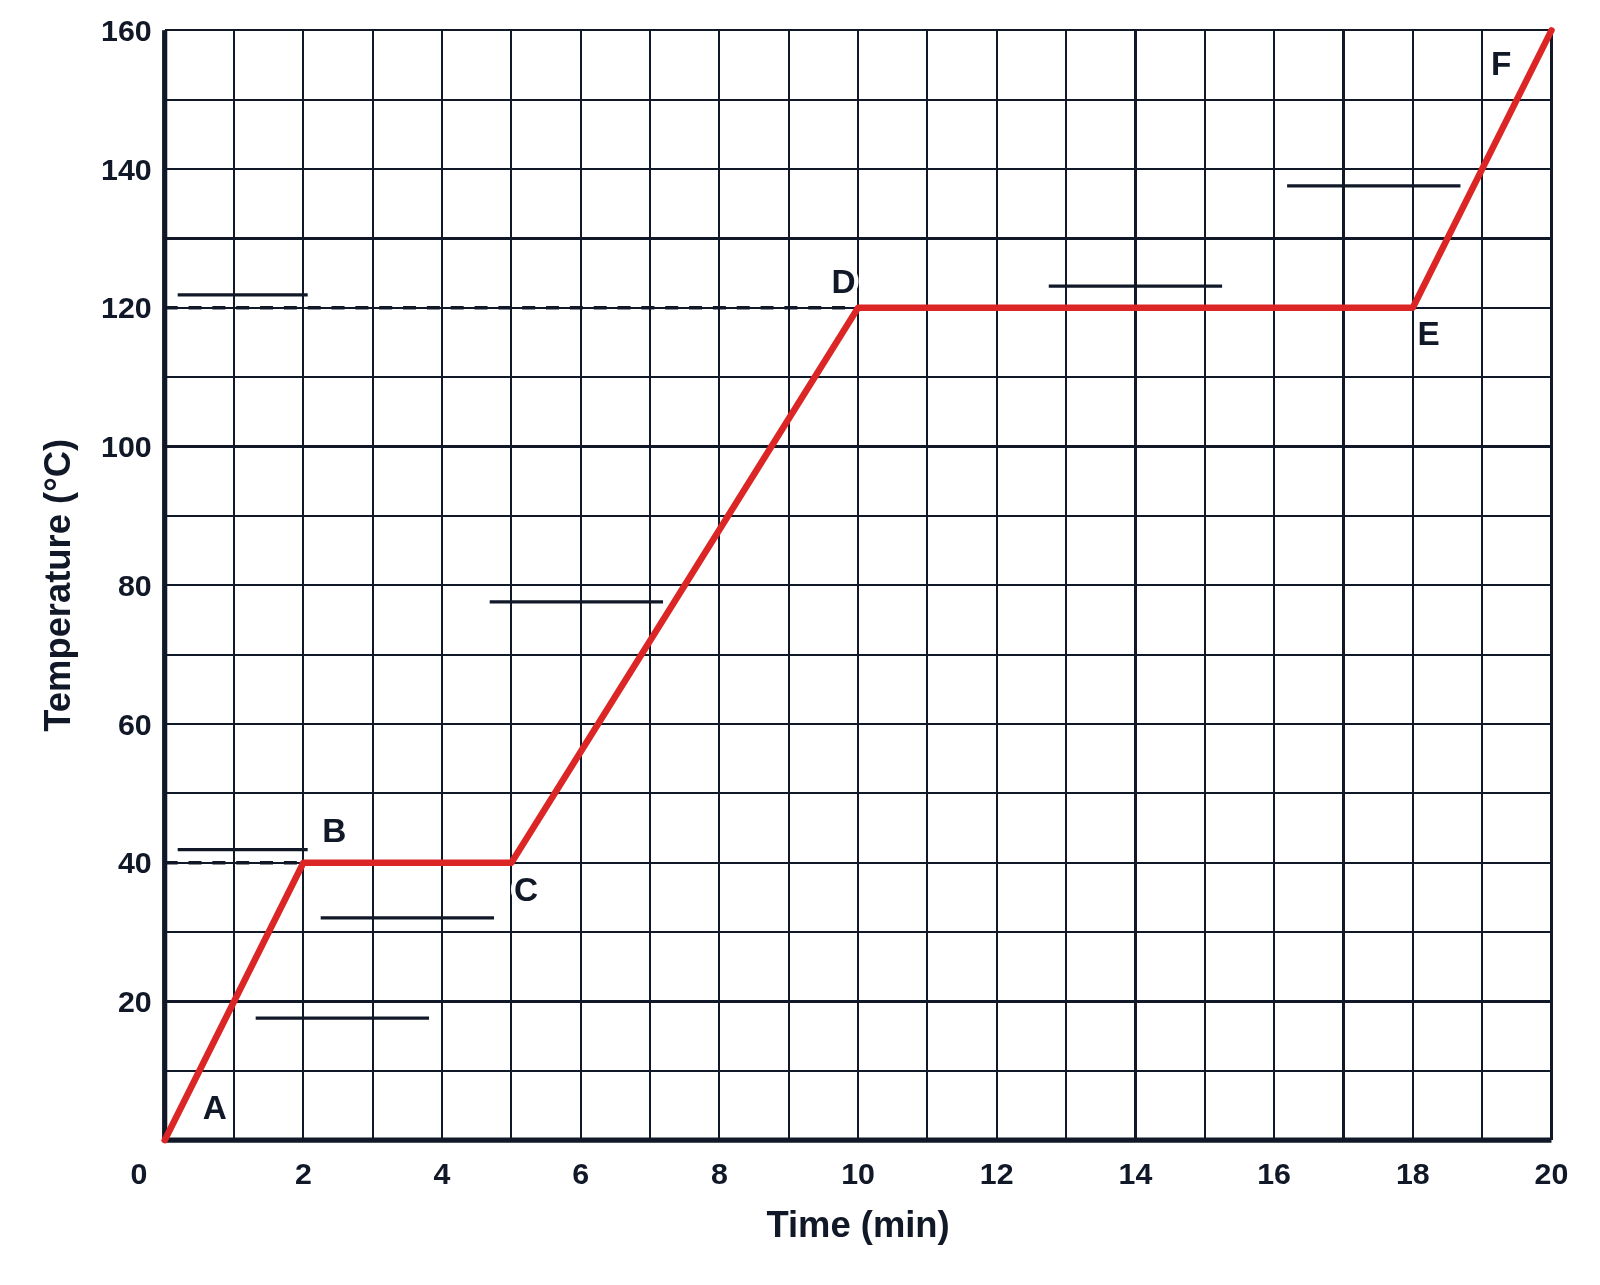
Heating curve of water, lettered A to F

An example figure from the Heating and Cooling Curve generator.
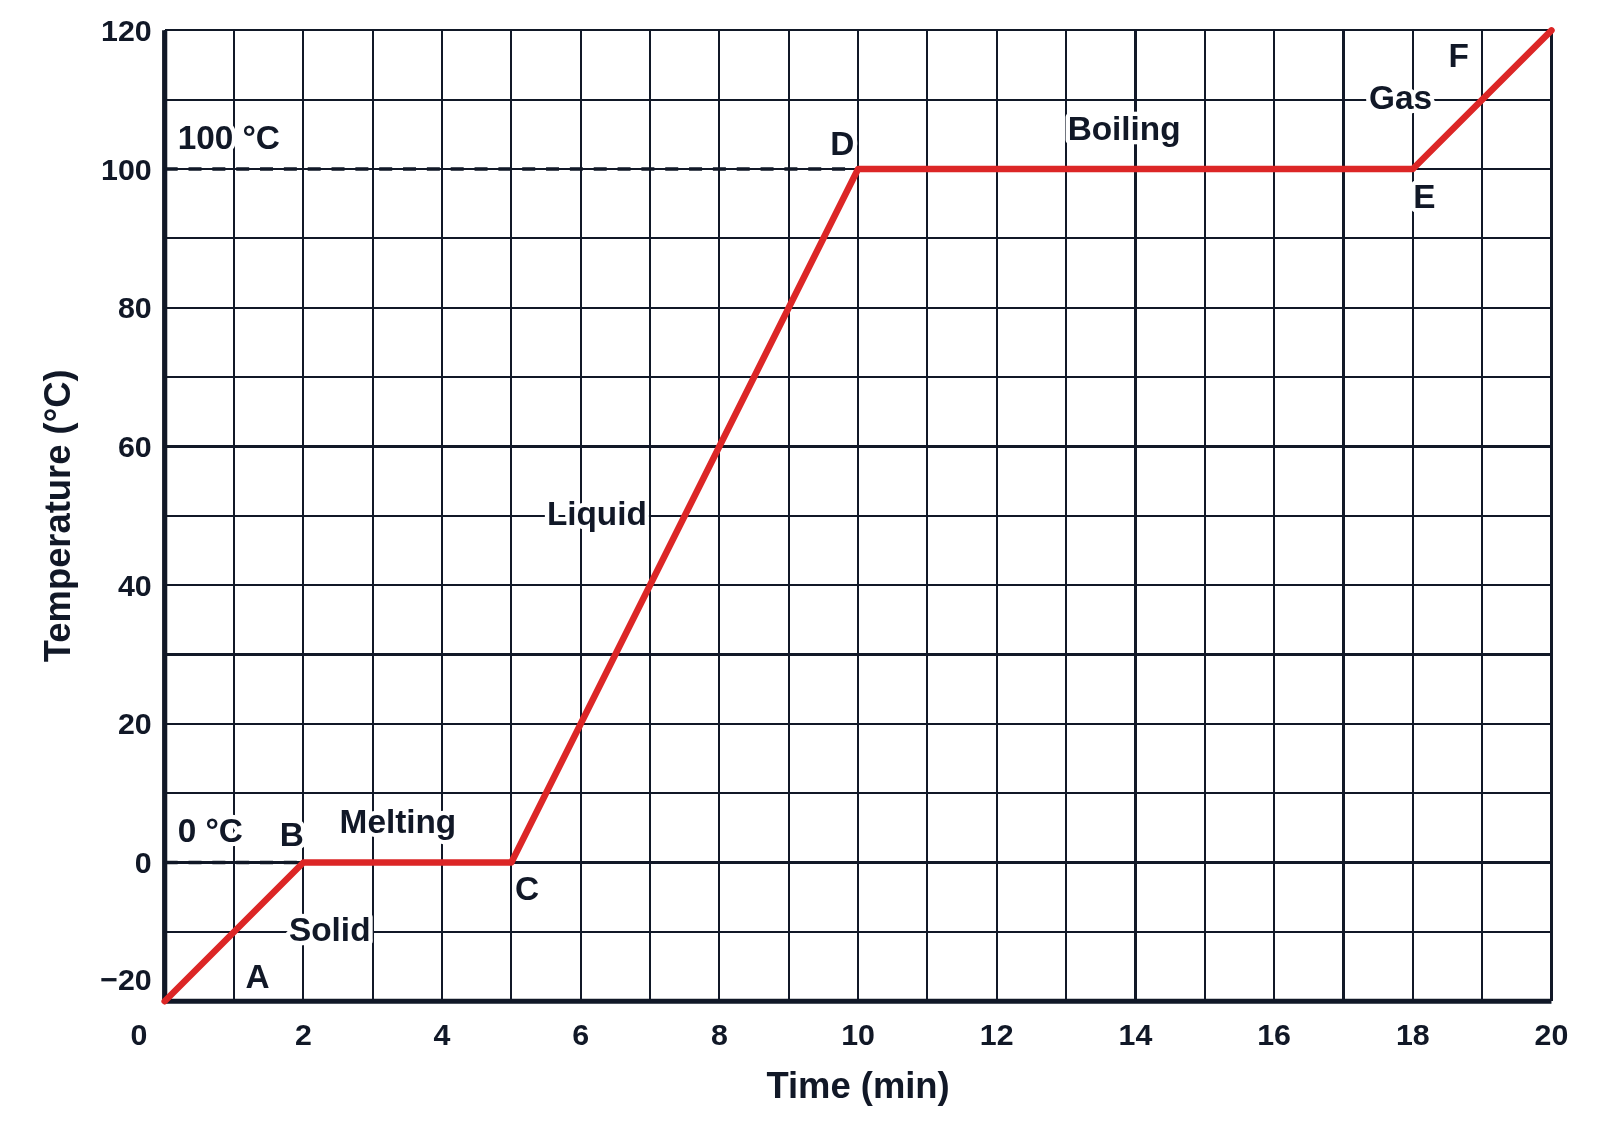
Heating curve of water from ice at −20 °C to steam at 120 °C, with plateaus at 0 and 100 °C labeled Melting and Boiling, corners lettered A to F
The temperature of water heated steadily from ice at −20 °C to steam at 120 °C, against time. The curve rises through the solid, stays flat at 0 °C while the ice melts, rises through the liquid, stays flat at 100 °C while the water boils, then rises through the gas. Its corners are lettered A to F, the sloped segments are labeled with their states and the plateaus with the changes, and dashed lines run from the plateaus to the temperature axis, with 0 °C and 100 °C written by them.

Editing opens it in Heating and Cooling Curve with these settings, to change anything and copy or download your own.

Answer key

  • Water: melting point 0 °C, boiling point 100 °C
  • A–B: Solid warms from −20 °C to 0 °C
  • B–C: Melting at 0 °C
  • C–D: Liquid warms from 0 °C to 100 °C
  • D–E: Boiling at 100 °C
  • E–F: Gas warms from 100 °C to 120 °C

Free to use in your tests, worksheets, slides or anything else. Open source under Apache 2.0. How to reuse our figures
More Heating and Cooling Curve examples