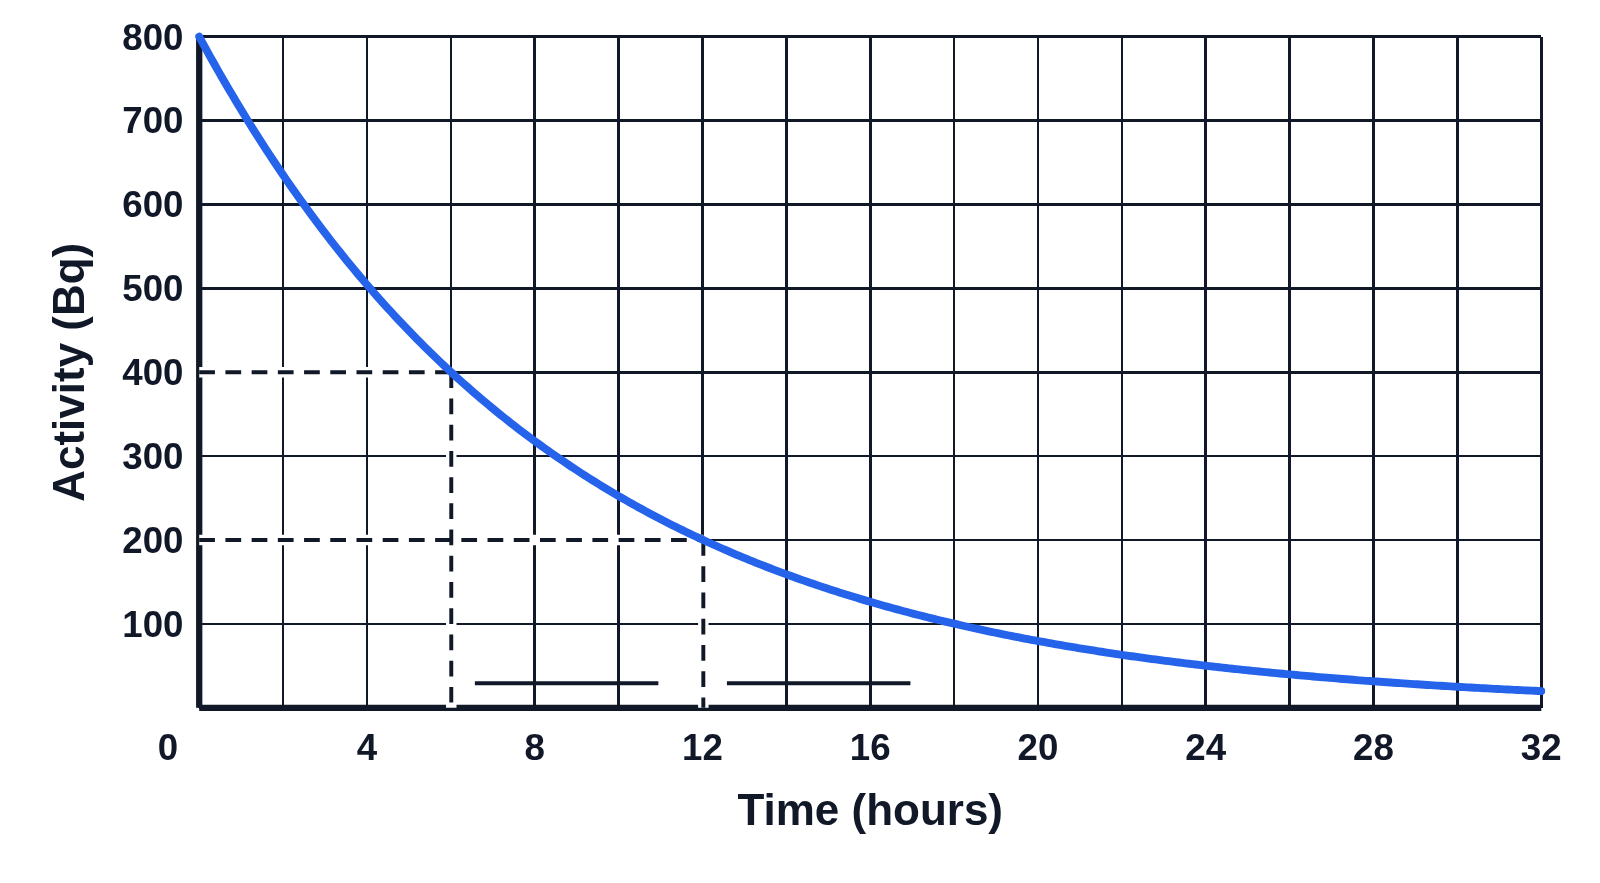
Plot the decay curve: Isotope X, half-life 10 years
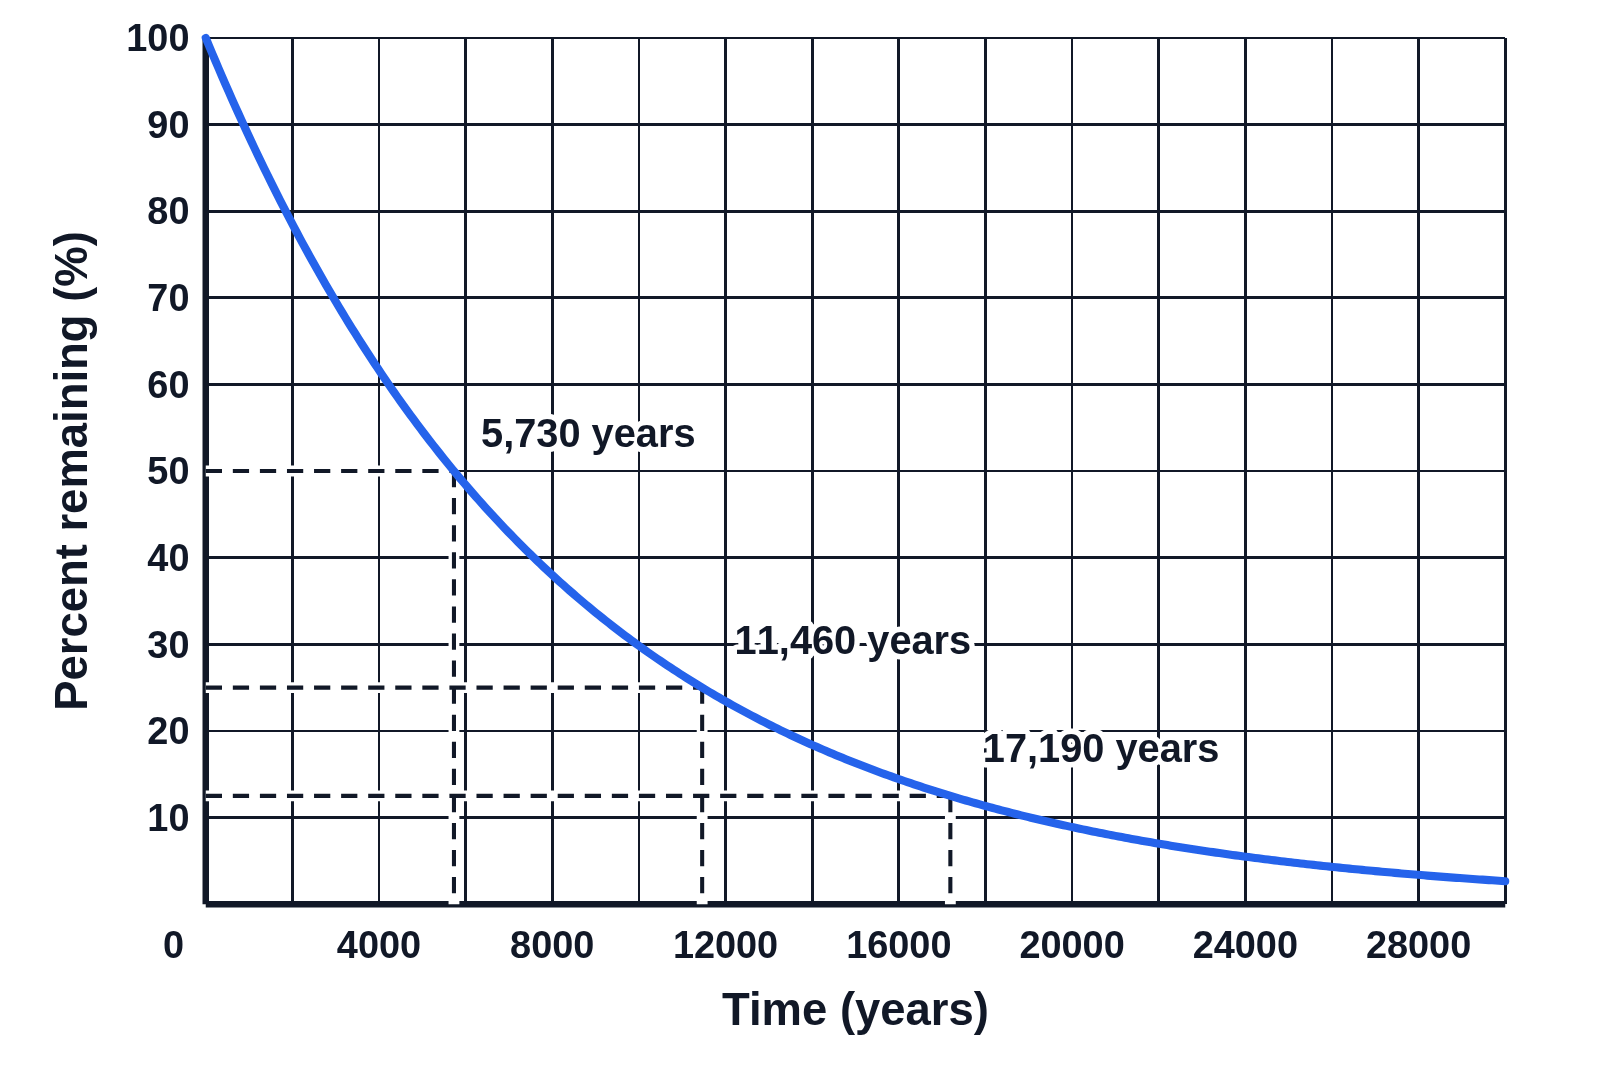
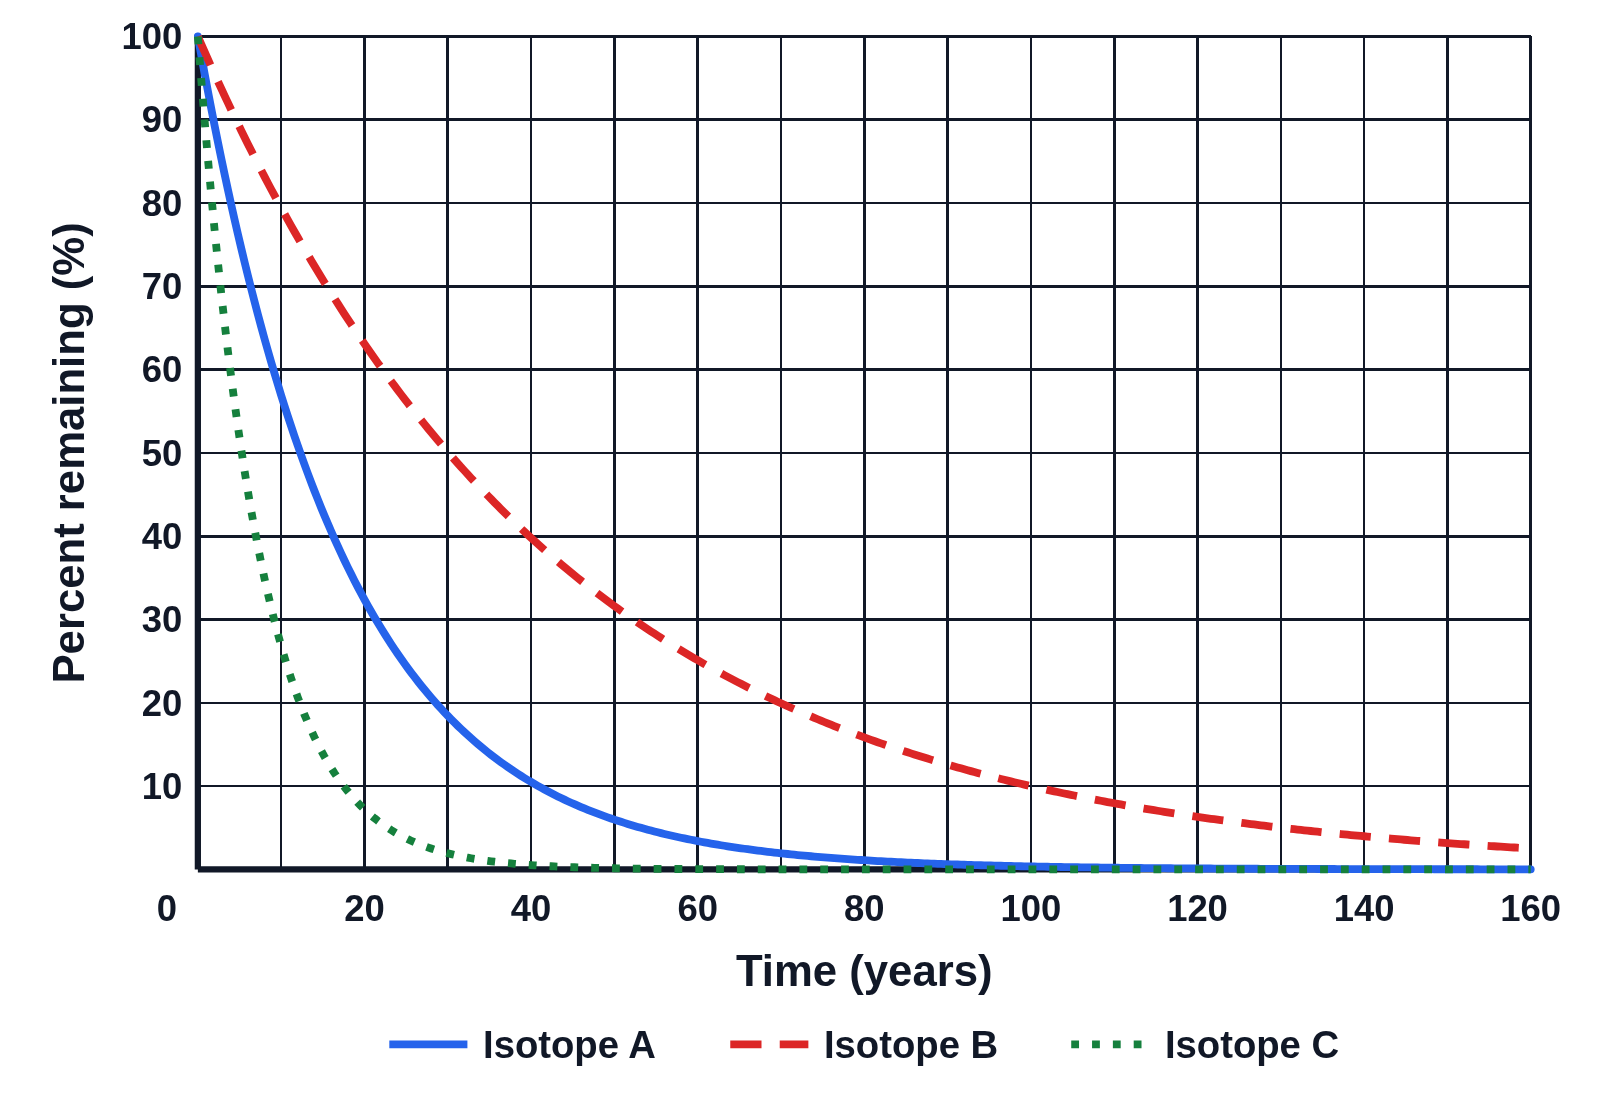
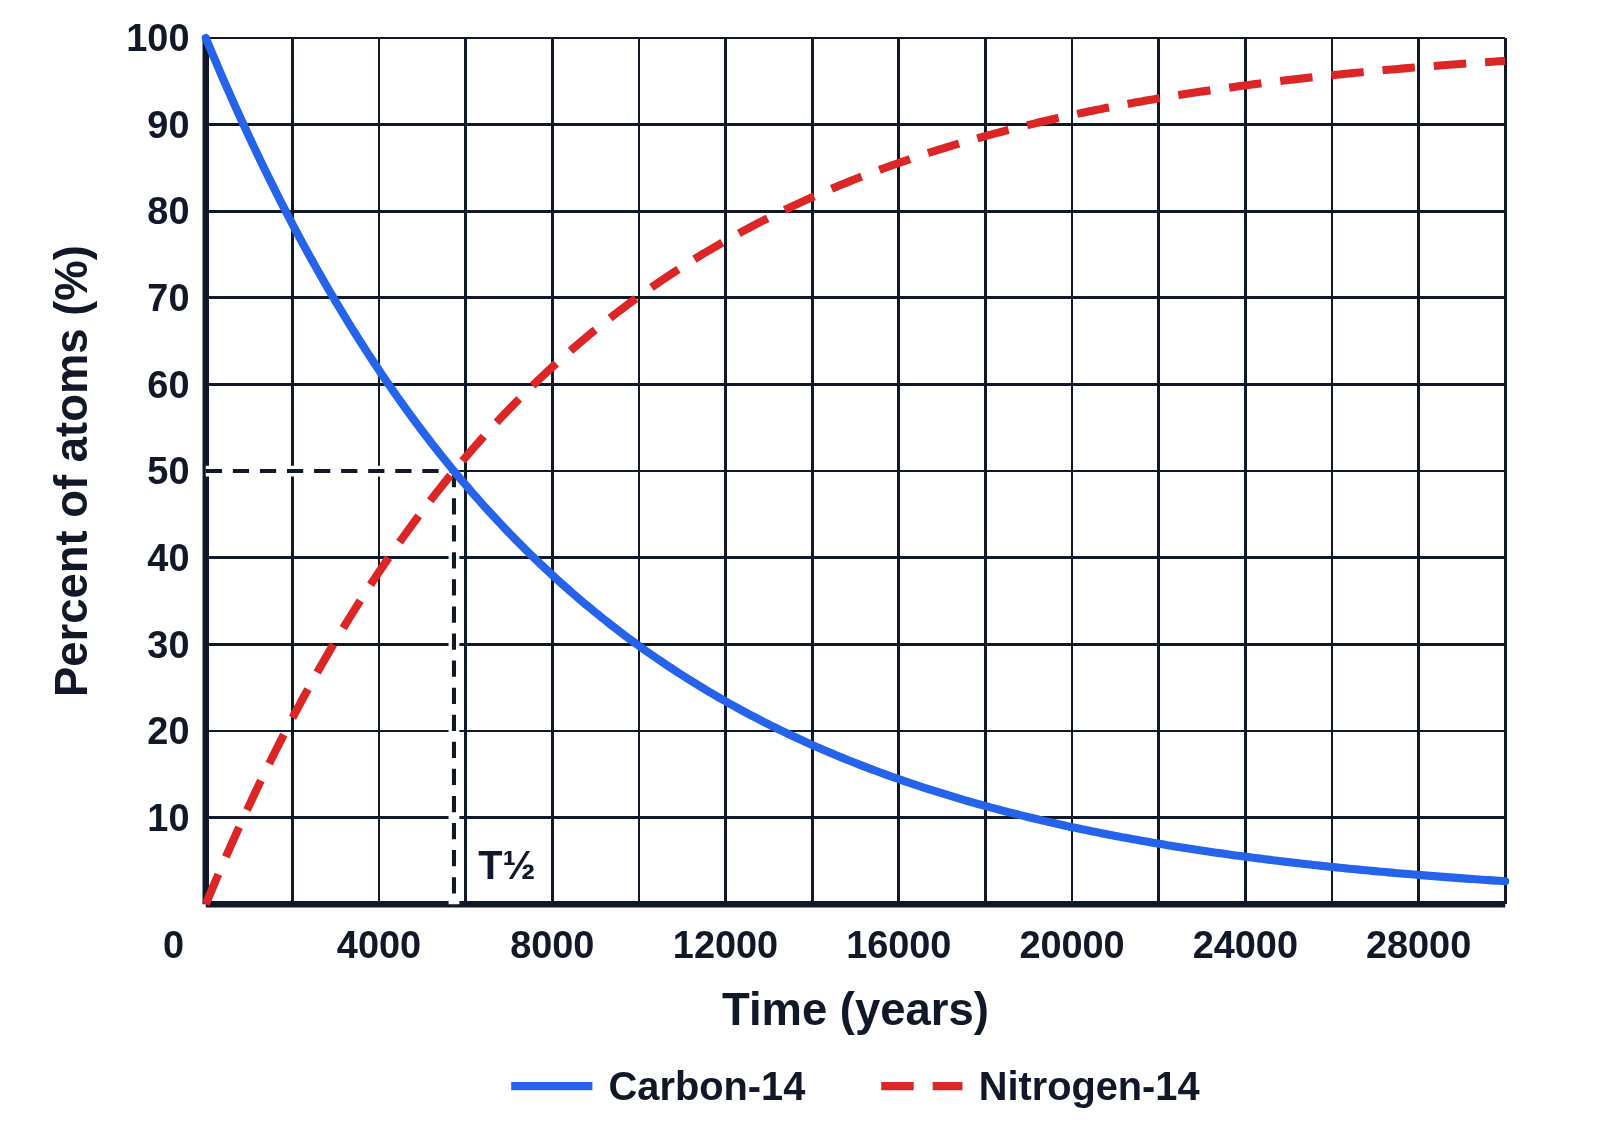
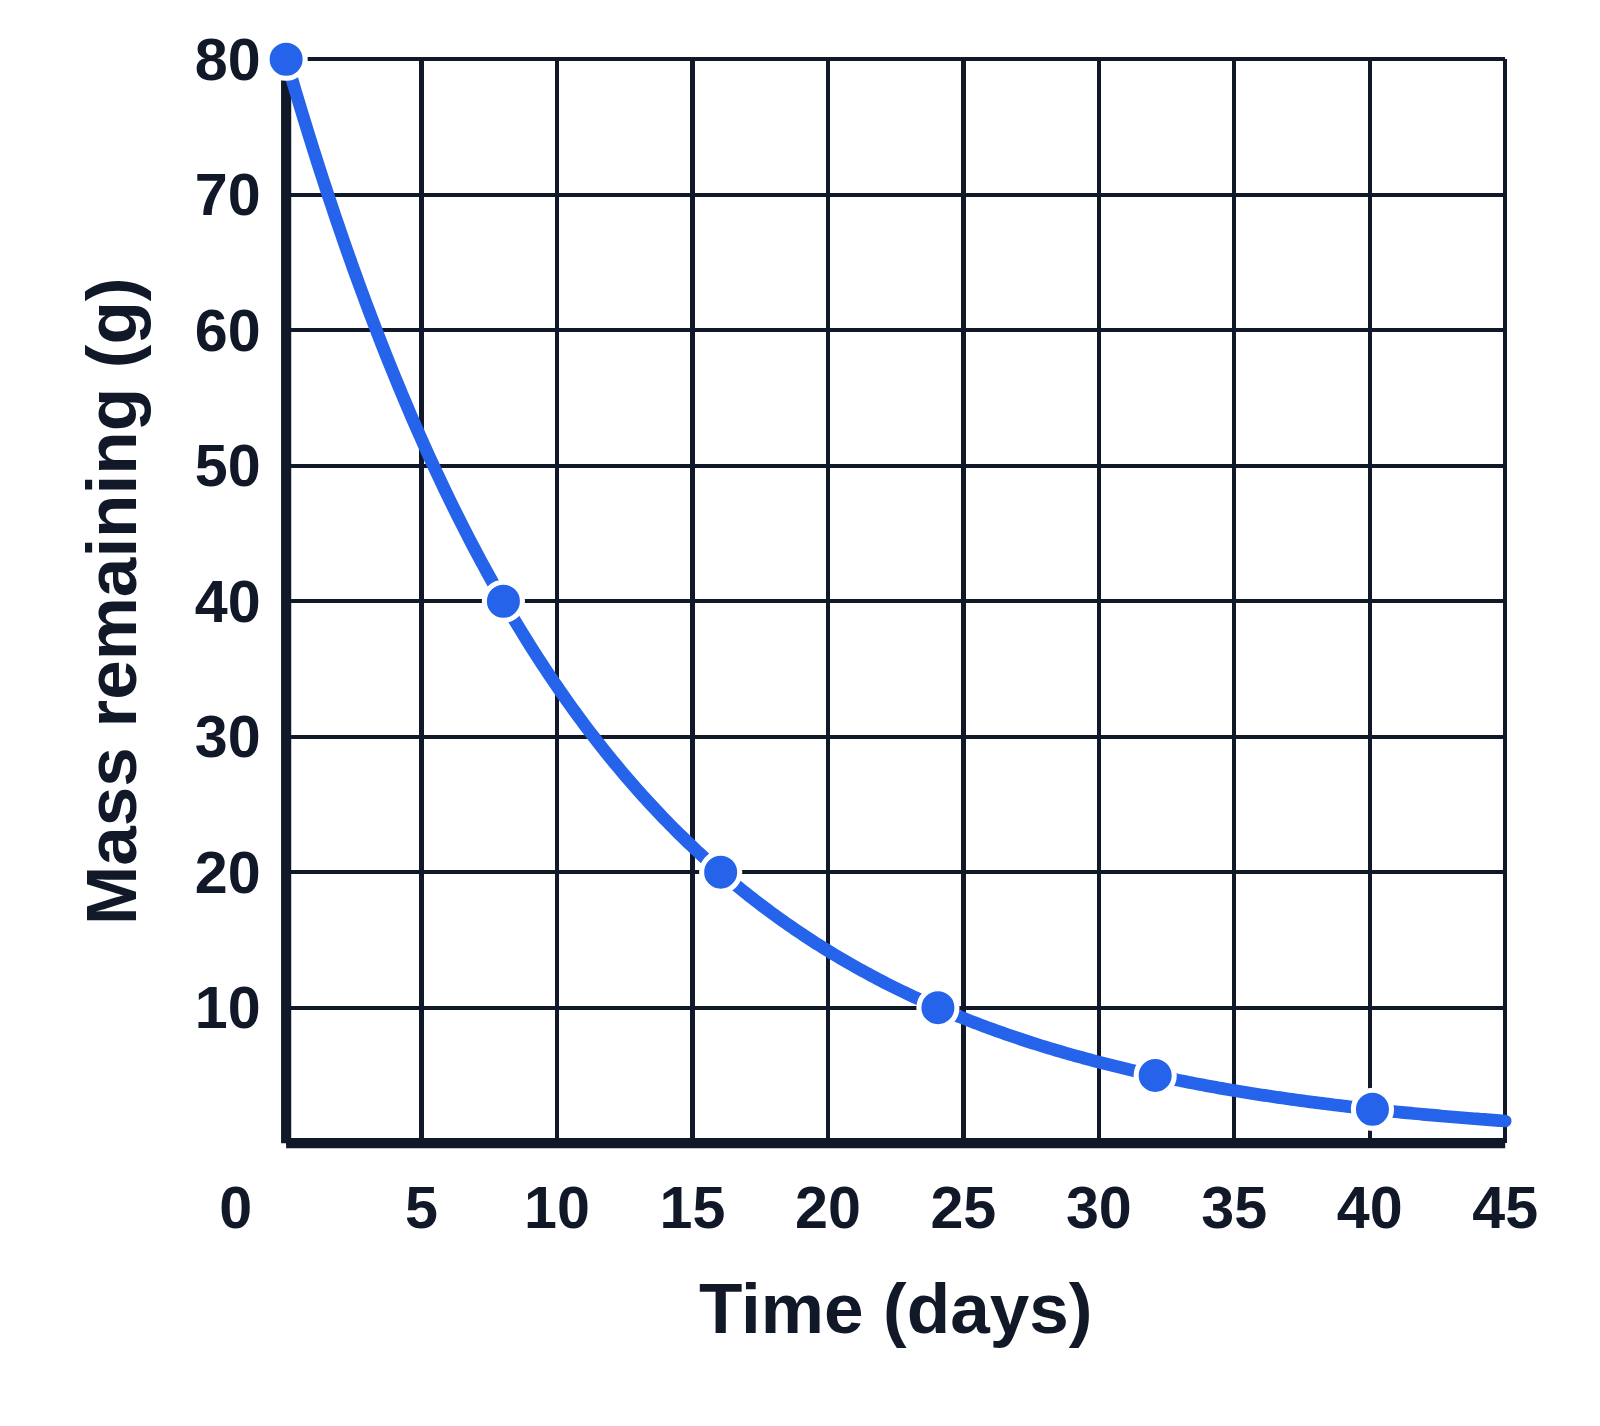
An example figure from the Half-Life Graph generator.
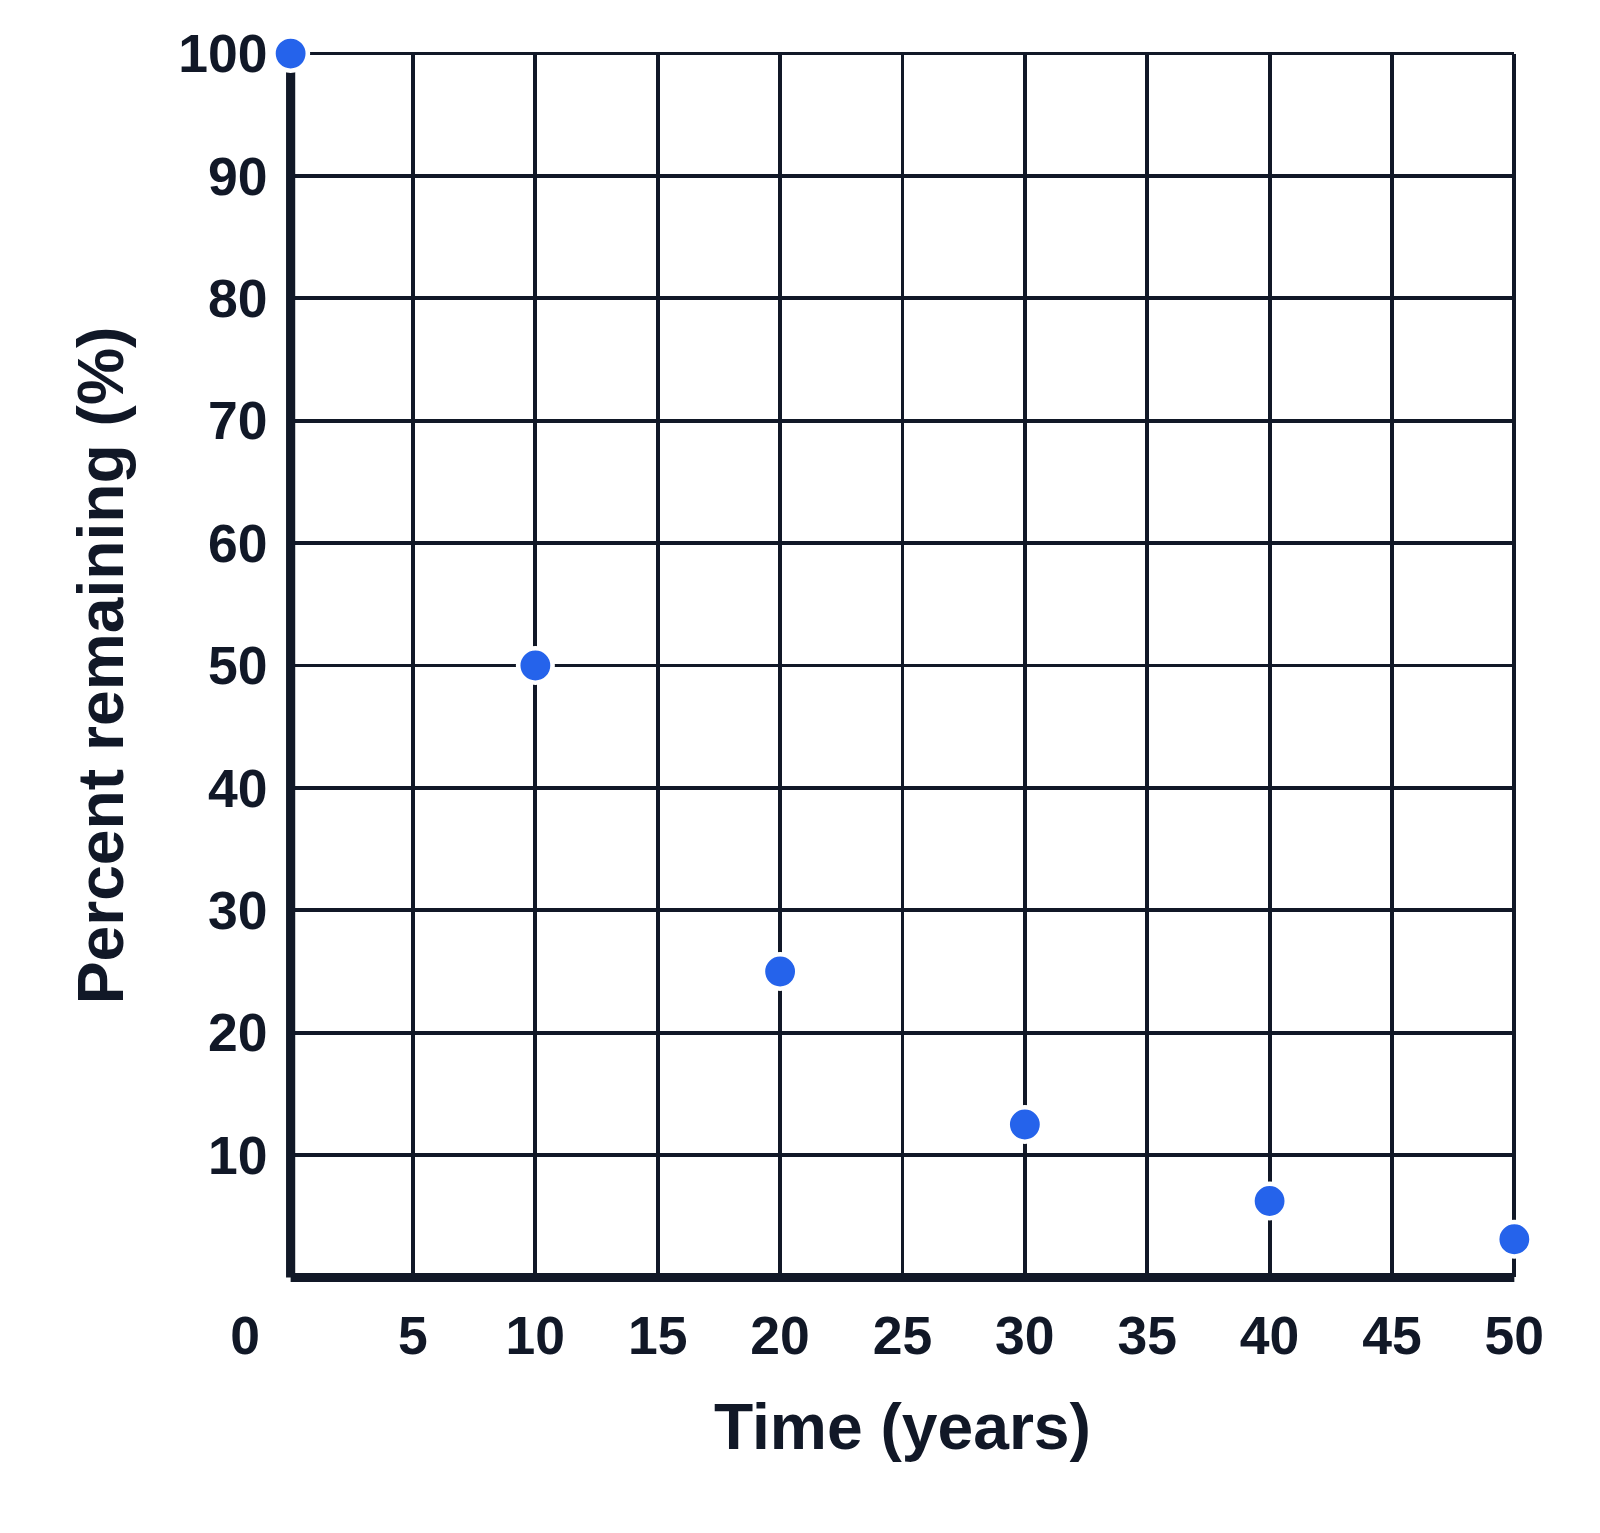
Editing opens it in Half-Life Graph with these settings, to change anything and copy or download your own.
Answer key
- Isotope X: half-life 10 years, λ = 0.0693 per year; beta decay to Isotope Y
Free to use in your tests, worksheets, slides or anything else, no credit needed. Public domain under CC0 1.0. How to reuse our figures